| Emissions Type | FY2020 | FY2021 | FY2022 | FY2023 | FY2024 |
|---|---|---|---|---|---|
| Scope 1 emissions (t-CO2e) | 218 | 1,470 | 1,406.01 | 1,256.52 | 1,325.61 |
| Scope 2 emissions (t-CO2e) (location-based) |
– | 13,442 | 12,370.24 | 11,571.46 | 9,793.32 |
| Scope2 emissions (t-CO2e) (market-based) |
13,475 | 11,593 | 9,347.43 | 7,723.36 | 6,987.62 |
| Total Scope 1 & 2 emissions (t-CO2e) (market-based) |
13,692 | 13,064 | 10,753.44 | 8,979.88 | 8,313.23 |
Note:
| Emissions Type | FY2021 | FY2022 | FY2023 | FY2024 | |
|---|---|---|---|---|---|
| Scope3 Emissions (t-CO2e) | 632,737 | 615,597.43 | 522,815.75 | 653,389.97 | |
| Categories | Category 1: Purchased Goods and Services | 251,490 | 229,241.64 | 287,511.77 | 320,442.32 |
| Category 2: Capital Goods | 20,684 | 33,493.09 | 29,055.87 | 29,570.13 | |
| Category 3: Fuel- and Energy-Related Activities Not Included in Scope 1 or Scope 2 | 2,276 | 2,329.76 | 2,251.97 | 2,081.66 | |
| Category 4: Upstream Transportation and Distribution | 1,785 | 3,141.19 | 5,868.37 | 3,095.68 | |
| Category 5: Waste Generated in Operations | 31 | 31.43 | 44.43 | 95.77 | |
| Category 6: Business Travel | 2,570 | 4,366.65 | 4,769.61 | 5,189.56 | |
| Category 7: Employee Commuting | 1,028 | 1,210.90 | 1,450.47 | 1,545.20 | |
| Category 8: Leased assets (upstream) | NA | ||||
| Category 9: Transportation and delivery (downstream) | NA | ||||
| Category 10: Processing of sold products | NA | ||||
| Category 11: Use of Sold Products | 352,767 | 341,617.79 | 191,765.94 | 291,213.58 | |
| Category 12: End-of-Life Treatment of Sold Products | 105 | 164.97 | 97.33 | 156.07 | |
| Category 13: Leased assets (downstream) | NA | ||||
| Category 14: Franchises | NA | ||||
| Category 15: Investments | NA | ||||
Note:
| Consumption Type | FY2020 | FY2021 | FY2022 | FY2023 | FY2024 | |
|---|---|---|---|---|---|---|
| Energy consumption (kL) | 7,425 | 7,836 | 7,607.51 | 7,189.07 | 6,553.03 | |
| (Energy types) | Purchased electricity (kWh) | – | 27,229,042 | 25,835,292.51 | 24,502,084.91 | 22,233,798.84 |
| Purchased electricity from renewable energy sources (included in the above purchased electricity) (kWh) |
– | 2,025,840 | 6,041,211.61 | 6,656,421.06 | 7,361,145.70 | |
| City gas (m3) | – | 578,424 | 545,838.77 | 462,947.54 | 489,935.76 | |
| Heavy fuel oil A (kL) | – | 0.68 | 1.99 | 8.50 | 10.02 | |
| Gasoline (kL) | – | 90 | 90.83 | 97.12 | 99.45 | |
| LPG (m3) | – | 404 | 745.00 | 849.30 | 807.00 | |
| Hot water (GJ) | – | 195.70 | 197.68 | 212.68 | 210.57 | |
| Cold water (GJ) | – | 1,999.80 | 6,740.96 | 7,039.96 | 6,304.58 | |
| Steam (GJ) | – | 168.20 | 136.87 | 131.36 | 194.00 | |
Note:
| Consumption Type | FY2020 | FY2021 | FY2022 | FY2023 | FY2024 |
|---|---|---|---|---|---|
| Water withdrawal (m3) | – | – | – | – | 50,093.40 |
| Water discharge (m3) | – | – | – | – | 48,846.82 |
| Water use (m3) | 13,000 | 49,477 | 53,006.69 | 51,341.58 | – |
| Water consumption (m3) | – | – | – | – | 1,246.58 |
Note:
| Emissions Type | FY2020 | FY2021 | FY2022 | FY2023 | FY2024 | |
|---|---|---|---|---|---|---|
| Waste (t) | 213.30 | 648.60 | 339.07 | 386.26 | 434.71 | |
| Waste Types | Recycled (t) | – | 279.50 | 267.84 | 252.35 | 296.27 |
| Landfilled (t) | – | 17.00 | 0.00 | 0.00 | 1.40 | |
| Incinerated (t) | – | 54.72 | 62.14 | 93.17 | 84.30 | |
| Other (t) | – | 297.39 | 9.09 | 40.74 | 52.74 | |
Note:
| Consumption Type | FY2020 | FY2021 | FY2022 | FY2023 | FY2024 |
|---|---|---|---|---|---|
| Paper used (kg) | – | 25,696 | 23,697.63 | 23,649.75 | 20,338.39 |
| Paper used (ten thousand sheets) | 725 | – | – | – | – |
Note:
The Group did not emit or transfer any harmful or potentially harmful chemical substances in fiscal 2022.
In order to improve the reliability of its non-financial information, the Group obtains independent assurance from a third party.
Environmental data covered by the fiscal 2024 assurance statement includes the following.

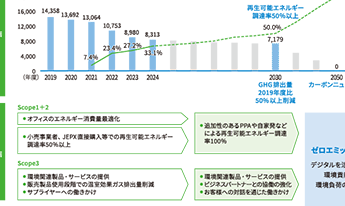
BIPROGYグループは、「環境長期ビジョン2050」に基づき、グループ全体の事業活動を通じてゼロエミッション社会の実現を目指しています。また、パリ協...
環境長期ビジョン2050に掲げる「ゼロエミッション社会実現」に向けては、サプライチェーン全体でのGHG排出量の削減が重要であることから「2027年まで...
In order to improve the reliability of its non-financial information, the G...